Understanding YouTube Revenue: CPM, RPM, and Beyond
What is YouTube CPM and RPM?
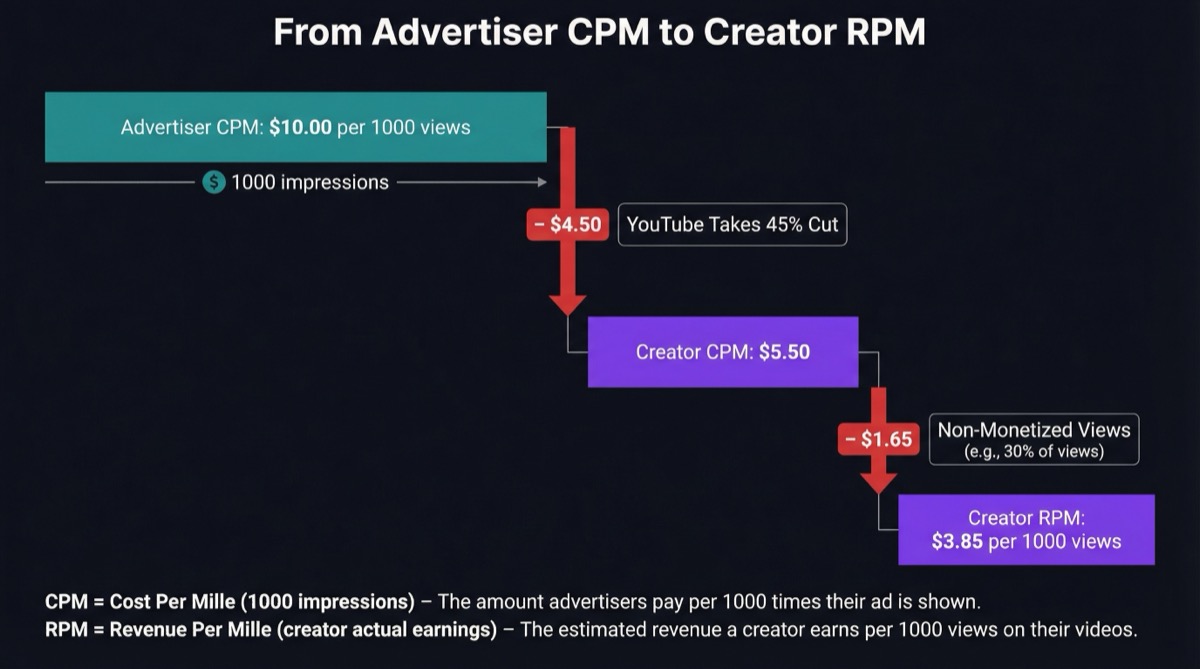
CPM (Cost Per Mille) is what advertisers pay per 1,000 ad impressions. RPM (Revenue Per Mille) is what Creators actually earn per 1,000 views after YouTube's share. RPM is the more relevant metric for Creator earnings.
Educational Content: This content is for educational purposes only and does not constitute investment advice. All investments involve risk, including potential loss of principal. See full disclosures.
What Is CPM?
CPM stands for Cost Per Mille — the Latin word "mille" meaning one thousand. In the context of YouTube advertising, CPM represents the amount an advertiser pays for 1,000 ad impressions on a video. It is a standard metric across the digital advertising industry, not unique to YouTube, and it measures the cost of reaching an audience from the advertiser's perspective.
When an advertiser runs a campaign on YouTube, they bid to place their ads in front of specific audiences. YouTube's ad system operates as an auction: advertisers compete for ad placements based on targeting criteria such as viewer demographics, interests, geographic location, and the content category of the video. The winning bid determines the CPM for that particular ad impression. Because this is an auction-based system, CPM rates are not fixed — they fluctuate constantly based on supply and demand.
It is important to understand that CPM counts ad impressions, not video views. A single video view may generate zero, one, or multiple ad impressions depending on whether the viewer sees an ad, what type of ad is displayed, and whether the video contains multiple ad breaks. Not every view generates an ad impression. YouTube may not serve an ad on every view due to factors such as the viewer using an ad blocker, the viewer's geographic location, advertiser targeting preferences, or YouTube's own ad load decisions.
Types of YouTube Ads
YouTube supports several ad formats, each of which contributes to CPM differently:
- Pre-roll ads appear before the video starts. These can be skippable (after 5 seconds) or non-skippable (typically 15-20 seconds). Non-skippable ads generally command higher CPMs because advertisers are assured the viewer will see the full message.
- Mid-roll ads appear during the video and are available on videos longer than 8 minutes. Creators can place mid-roll ad breaks manually or allow YouTube to insert them automatically. Mid-roll ads can significantly increase ad impressions per view.
- Display ads appear alongside the video player on desktop. These are visual banner ads that do not interrupt the viewing experience.
- Overlay ads are semi-transparent ads that appear on the lower portion of the video player on desktop.
- Bumper ads are non-skippable ads of 6 seconds or fewer that play before the video.
Each ad type has different CPM characteristics. Video ads (pre-roll, mid-roll) generally have higher CPMs than display or overlay ads because they capture more viewer attention. The mix of ad types a Creator's videos receive depends on factors largely outside the Creator's control, though enabling mid-roll ads on longer videos is one lever Creators can use to increase total ad impressions.
What CPM Tells You
CPM is fundamentally an advertiser-side metric. It tells you how much advertisers are willing to pay to reach an audience through a particular Creator's content. A high CPM indicates that advertisers find the Creator's audience valuable — typically because the audience has characteristics that align with high-value advertising goals, such as being located in wealthy countries, belonging to a desirable age demographic, or being interested in topics where consumers have strong purchase intent.
However, CPM alone does not tell you how much a Creator actually earns. To understand Creator earnings, you need to look at RPM.
What Is RPM?
RPM stands for Revenue Per Mille and represents the amount a Creator actually earns per 1,000 video views. Unlike CPM, which measures what advertisers pay, RPM measures what the Creator receives. This makes RPM the more relevant metric for understanding a Creator's actual revenue performance.
YouTube introduced the RPM metric in YouTube Studio analytics in 2020 to give Creators a clearer picture of their earnings. Before RPM existed, Creators often confused their CPM with their actual earnings, leading to misunderstandings about channel revenue.
How RPM Is Calculated
RPM is calculated by dividing a Creator's total revenue by the total number of views, then multiplying by 1,000:
RPM = (Total Revenue / Total Views) x 1,000
There are two critical differences between RPM and CPM that explain why RPM is always lower:
First, RPM accounts for YouTube's revenue share. YouTube typically keeps approximately 45% of ad revenue and pays the Creator approximately 55%. So if an advertiser pays $20 CPM, the Creator receives roughly $11 of that $20 before RPM is even calculated.
Second, RPM is based on total views, not ad impressions. Many views do not generate any ad revenue at all — the viewer may not see an ad, the view may come from a region with low ad demand, or the viewer may be using an ad blocker. Because RPM includes all views in its denominator (including non-monetized views), it is always lower than CPM.
What RPM Includes
RPM in YouTube Studio reflects the Creator's total YouTube revenue from all YouTube monetization sources, divided by total views. This can include:
- Ad revenue (the largest component for most Creators)
- YouTube Premium revenue (a share of Premium subscribers' fees when they watch the Creator's content)
- Channel membership revenue
- Super Chat and Super Stickers revenue
- Super Thanks revenue
For the purposes of understanding CRT distributions, the revenue that matters is typically the Creator's YouTube AdSense ad revenue, as specified in each offering's Form C. The broader RPM metric in YouTube Studio may include revenue streams that are not part of the CRT revenue-sharing agreement.
CPM vs RPM Explained
Understanding the relationship between CPM and RPM is essential for both Creators evaluating their revenue and Investors analyzing Creator offerings. These two metrics measure related but fundamentally different things, and confusing them can lead to significant misunderstandings about a channel's revenue potential.
| Metric | What It Measures | Based On | Who It's For | Always Higher? |
|---|---|---|---|---|
| CPM | Advertiser cost per 1,000 ad impressions | Ad impressions only | Advertisers | Yes |
| RPM | Creator earnings per 1,000 views | All views (monetized and non-monetized) | Creators | No (always lower than CPM) |
Why CPM Is Always Higher Than RPM
There are three compounding reasons CPM exceeds RPM:
- YouTube's 45% share. Advertisers pay $X, but the Creator receives only about 55% of $X.
- Not all views are monetized. CPM only counts views where an ad was actually served. RPM counts all views, including those with no ad at all.
- Different denominators. CPM divides by ad impressions; RPM divides by total views. Since total views always exceed ad impressions, RPM's denominator is larger.
As a rough rule of thumb, a Creator's RPM is typically 40-60% of their CPM, though this ratio varies based on the channel's monetization rate (what percentage of views actually serve an ad) and the mix of ad types.
Which Metric Matters More?
For Creators, RPM is the more important metric because it directly reflects actual earnings. A Creator with a $30 CPM but a low monetization rate might earn less than a Creator with a $15 CPM and a high monetization rate.
For Investors evaluating CRT offerings, both metrics provide useful information. CPM indicates the value of the Creator's audience to advertisers — a factor that is somewhat durable over time if the audience and content niche remain stable. RPM provides a more direct picture of the Creator's actual revenue generation capacity. When analyzing a Creator's historical revenue data in offering documents, understanding the relationship between these metrics helps explain revenue fluctuations and set realistic expectations.
Factors That Affect CPM and RPM
YouTube advertising rates are not static. They fluctuate based on a complex interplay of factors, some within a Creator's influence and many outside it. Understanding these factors is essential for interpreting revenue data and setting expectations.
Content Niche
The single most significant factor influencing CPM is the content niche. Advertisers in certain industries — particularly finance, insurance, technology, and business services — spend significantly more per ad impression because their products and services have high customer lifetime values. A financial services company willing to pay $50 to acquire a customer will bid more aggressively for ad placements than a mobile game company with a $2 average revenue per user.
Audience Demographics
Advertisers target specific demographic groups based on age, gender, income level, education, and interests. Audiences composed primarily of adults aged 25-54 with disposable income tend to command higher CPMs than audiences skewing younger (under 18) or older (over 65). This is because the 25-54 demographic represents the highest-spending consumer group for most product categories.
Geographic Distribution
Where a Creator's audience is located has a dramatic impact on CPM. Viewers in the United States, Canada, the United Kingdom, Australia, and parts of Western Europe generate significantly higher CPMs than viewers in Southeast Asia, India, Latin America, or Africa. This disparity exists because advertiser spending is concentrated in wealthy, English-speaking markets where consumer purchasing power is highest.
Seasonality
Advertising budgets follow consistent annual patterns driven by consumer spending cycles and corporate budget planning. Q4 consistently produces the highest CPMs across nearly all content categories, while Q1 produces the lowest.
Video Length and Format
Videos longer than 8 minutes can include mid-roll ad breaks, which increase the number of ad impressions per view and can significantly boost per-video revenue. Creators who produce longer content generally have higher RPMs (on a per-view basis) than those producing shorter content, all else being equal.
Engagement and Watch Time
YouTube's algorithm favors content with high engagement and watch time. Videos that hold viewer attention longer are recommended more frequently, leading to more views and more ad impressions. Additionally, viewers who watch a larger portion of a video are more likely to see mid-roll ads, increasing revenue per view.
Advertiser Demand and Competition
In any auction-based system, prices rise with competition. When more advertisers compete for the same audience segments, CPMs increase. Conversely, when advertiser demand softens (as in early Q1), CPMs decrease. Major events — product launches, elections, economic shifts — can temporarily affect advertiser demand in specific categories.
CPM by Content Niche
The following table provides approximate CPM ranges by content niche. These ranges are estimates based on publicly available industry data and Creator-reported figures. Actual CPMs vary widely based on all the factors discussed above, and individual Creator experiences may fall outside these ranges.
| Content Niche | Approximate CPM Range (USD) | Key Driver |
|---|---|---|
| Finance / Business / Investing | $20 - $40 | High customer lifetime value for financial products |
| Technology / Software | $12 - $25 | Enterprise and consumer tech advertising spend |
| Health / Fitness | $8 - $18 | Healthcare, supplements, and fitness product advertising |
| Education / Online Courses | $8 - $15 | Ed-tech and professional development advertising |
| DIY / How-To | $6 - $14 | Home improvement and tool brand advertising |
| Travel | $6 - $14 | Travel booking, airline, and hospitality advertising |
| Food / Cooking | $5 - $12 | Food brand, kitchen appliance, and grocery advertising |
| Lifestyle / Vlog | $3 - $8 | Broad consumer brand advertising |
| Entertainment | $4 - $10 | Wide-reach campaigns, often high volume but lower CPM |
| Gaming | $3 - $8 | Gaming peripheral and software advertising |
| Kids Content | $2 - $5 | Limited advertiser categories due to COPPA regulations |
| Music | $1 - $4 | High volume but low advertiser targeting specificity |
These ranges reflect CPM — what advertisers pay per 1,000 ad impressions. The Creator's actual RPM will be significantly lower after accounting for YouTube's revenue share and non-monetized views.
It is worth noting that a Creator does not necessarily need a high CPM to generate substantial revenue. Channels in lower-CPM niches like gaming or entertainment can compensate through sheer viewership volume. A gaming channel with a $5 CPM and 50 million monthly views will generate far more total revenue than a finance channel with a $35 CPM and 500,000 monthly views.
Geographic CPM Variations
Audience geography is one of the most impactful factors determining a Creator's revenue per view. The differences are substantial — a view from the United States can generate 10 to 20 times more ad revenue than a view from a lower-CPM region.
The following table provides approximate relative CPM multipliers compared to a global average baseline. These are generalizations, and actual rates vary by niche and time period.
| Geographic Region | Relative CPM Level | Approximate CPM Multiplier |
|---|---|---|
| United States | Highest | 3x - 5x global average |
| Canada | Very High | 2.5x - 4x |
| United Kingdom | Very High | 2.5x - 4x |
| Australia | Very High | 2.5x - 4x |
| Germany / Western Europe | High | 2x - 3.5x |
| Japan / South Korea | High | 2x - 3x |
| Eastern Europe | Moderate | 1x - 1.5x |
| Brazil / Latin America | Below Average | 0.5x - 1x |
| Southeast Asia | Low | 0.3x - 0.7x |
| India | Low | 0.2x - 0.5x |
| Sub-Saharan Africa | Lowest | 0.1x - 0.3x |
Why Geography Matters So Much
The geographic disparity in CPM rates exists because advertisers allocate budgets based on where their potential customers are and how much those customers are likely to spend. In the United States, the average consumer spending power is dramatically higher than in India or Southeast Asia, so advertisers are willing to pay far more to reach a US-based viewer.
For Creators, this means that audience geographic composition is a critical factor in revenue. Two channels with identical viewership numbers can have vastly different revenue levels if one's audience is primarily in the United States and the other's is primarily in India. A Creator with 1 million monthly views from a predominantly US audience may earn several times more than a Creator with 1 million views from a predominantly Southeast Asian audience.
For Investors evaluating CRT offerings, understanding a Creator's audience geography provides important context for interpreting historical revenue data and forming expectations about future revenue. A Creator whose audience is shifting toward higher-CPM regions may see revenue increase even without viewership growth, while a Creator whose audience is shifting toward lower-CPM regions may see the opposite.
Seasonal CPM Patterns
YouTube CPM follows a remarkably consistent seasonal pattern year after year, driven primarily by the advertising industry's budget cycles and consumer spending patterns. Understanding this seasonality is important for both Creators planning their content strategy and Investors interpreting monthly distribution data.
Q4: The Peak (October - December)
Q4 is consistently the highest-CPM period of the year. Advertisers dramatically increase spending to capture consumer attention during the holiday shopping season, including Black Friday, Cyber Monday, and the Christmas/holiday gift-buying period. CPMs in November and December can be 50-100% higher than the annual average, and in some high-value niches, the increase can be even more dramatic.
For Creators, Q4 often represents the most lucrative period of the year. A Creator who earns $5,000 per month during most of the year might see earnings of $8,000 to $10,000 or more during November and December.
Q1: The Dip (January - March)
Q1 typically produces the lowest CPMs of the year. After the massive Q4 spending surge, advertisers reset their annual budgets. Many companies have already exhausted their previous year's marketing budget and are operating on newly approved annual plans with conservative early-year spending. January, in particular, often sees a sharp decline — sometimes referred to as the "January CPM cliff" — where rates can drop 30-50% from their December highs.
This Q1 dip is one of the most important seasonal patterns for CRT Investors to understand, because it directly affects monthly distribution amounts. A distribution reflecting January revenue will almost certainly be lower than one reflecting December revenue, even if the Creator's viewership is unchanged. This is not a sign of Creator underperformance — it is a structural feature of the advertising market.
Q2: Recovery (April - June)
CPMs generally recover during Q2 as advertisers settle into their annual spending plans and consumer activity picks up. Rates typically climb steadily from April through June, though they rarely reach Q4 levels.
Q3: Mixed (July - September)
Q3 is the most variable quarter. Some niches see a summer slowdown as consumer attention shifts outdoors and away from screens. Others, particularly back-to-school related content, may see temporary CPM increases. September often begins a gradual upward trend as advertisers prepare for the Q4 push.
Implications for Creators and Investors
Seasonal CPM patterns create recurring revenue volatility. For Creators, this means that planning content output and managing expenses should account for the Q1 dip. For Investors holding CRTs, understanding seasonality prevents misinterpreting normal seasonal fluctuations as signs of a Creator's declining performance. Comparing month-over-month distributions without accounting for seasonality can lead to incorrect conclusions. A more meaningful comparison is year-over-year for the same month or quarter.
Why CPM and RPM Matter for CRT Investors
For Investors considering or holding Channel Revenue Tokens, CPM and RPM are not abstract advertising metrics — they are foundational inputs that determine the size of your monthly distributions.
CRT distributions are based on a Creator's actual YouTube revenue, which is a direct function of viewership multiplied by RPM. Understanding the factors that drive CPM and RPM helps Investors evaluate offerings with greater context and interpret distribution patterns more accurately.
Evaluating Creator Offerings
When reviewing a Creator's offering documents, including the Form C, you may encounter historical revenue data. Understanding CPM and RPM helps you assess that data more critically:
- What niche does the Creator operate in? A Creator in a high-CPM niche like finance or technology has a structural advantage in revenue per view compared to a Creator in a lower-CPM niche like gaming or music. However, lower-CPM Creators may compensate with higher viewership volume.
- Where is the Creator's audience located? A Creator with a predominantly US-based audience will generate significantly more revenue per view than one with a global or developing-market audience.
- How long are the Creator's videos? Longer videos with mid-roll ad placements generate more ad impressions per view, which can substantially increase RPM.
Interpreting Distribution Variability
Once you hold CRTs, understanding CPM and RPM dynamics helps you interpret month-to-month changes in distribution amounts:
- A lower January distribution compared to December is almost certainly due to the seasonal Q1 CPM dip, not Creator underperformance.
- A distribution increase that coincides with a Creator entering a higher-CPM content niche may reflect a structural improvement in revenue per view.
- A distribution decline while viewership remains stable could indicate a shift in audience geography toward lower-CPM regions or a broader decline in advertiser demand in the Creator's niche.
Setting Realistic Expectations
Understanding that CPM and RPM fluctuate — sometimes significantly — helps Investors set realistic expectations about distribution variability. Distributions will not be the same each month, and the reasons for variation are often structural and industry-wide rather than specific to any individual Creator. The most informed CRT Investors are those who understand the advertising dynamics that drive Creator revenue.
Key Takeaways
- CPM (Cost Per Mille) measures advertiser cost per 1,000 ad impressions, while RPM (Revenue Per Mille) measures a Creator's actual earnings per 1,000 total video views. RPM is always lower than CPM.
- Content niche is the most significant CPM driver. Finance and business content commands CPMs of $20-$40, while music and kids content may see CPMs of $1-$5.
- Audience geography creates dramatic revenue differences. Views from the United States can generate 10-20x more ad revenue than views from lower-CPM regions.
- Seasonal CPM patterns are consistent and well-documented. Q4 is the peak due to holiday advertising, and Q1 is the trough as budgets reset. This directly affects monthly CRT distributions.
- RPM matters more than CPM for understanding Creator earnings because it accounts for YouTube's revenue share and non-monetized views.
- Both metrics provide important context for CRT Investors evaluating offerings, interpreting distribution variability, and setting realistic expectations about monthly distributions.
Frequently Asked Questions
What is the difference between YouTube CPM and RPM?
CPM (Cost Per Mille) measures what advertisers pay per 1,000 ad impressions on a video, while RPM (Revenue Per Mille) measures what a Creator actually earns per 1,000 total video views after YouTube takes its share. CPM is always higher than RPM for three reasons: YouTube retains approximately 45% of ad revenue before paying the Creator, not all views generate ad impressions, and CPM's denominator (ad impressions) is smaller than RPM's denominator (total views). For understanding a Creator's actual revenue, RPM is the more meaningful metric because it reflects real earnings across all views, not just the cost of advertising.
How much does YouTube pay per 1,000 views?
There is no single, universal answer to this question because YouTube revenue per 1,000 views varies dramatically based on multiple factors. The most influential factors are content niche, audience geography, and seasonality. RPM — the most accurate measure of Creator earnings per 1,000 views — can range from under $1 for music content viewed primarily in lower-CPM regions to $20 or more for finance content viewed primarily in the United States. Most Creators across all categories see RPM values somewhere between $2 and $10. It is important to remember that these figures fluctuate month to month, and individual Creator experiences vary widely.
Which YouTube niches have the highest CPM?
Finance, business, and investing content consistently commands the highest CPM rates on YouTube, often ranging from $20 to $40 per 1,000 ad impressions. This is because financial services companies have high customer lifetime values and are willing to pay premium rates to reach potential customers. Technology and software content ($12-$25), health and fitness ($8-$18), and education ($8-$15) also tend to have above-average CPMs. On the lower end, gaming ($3-$8), kids content ($2-$5), and music ($1-$4) typically have lower CPMs, though these categories often generate very high view counts that can offset the lower per-view revenue.
Why does CPM change throughout the year?
CPM fluctuates seasonally because advertiser spending follows consistent annual cycles driven by consumer behavior and corporate budget planning. Q4 (October through December) consistently produces the highest CPMs as companies significantly increase advertising budgets for holiday shopping — including Black Friday, Cyber Monday, and the broader gift-buying season. CPMs in November and December can be 50-100% higher than the annual average. Q1 (January through March) typically has the lowest CPMs because advertisers are resetting annual budgets after the holiday spending surge. This "January CPM cliff" can see rates drop 30-50% from December highs. Q2 and Q3 generally fall between these extremes, with a gradual recovery through spring and mixed results during summer.
How do CPM and RPM affect CRT distributions?
CRT distributions are monthly payments to Investors based on a Creator's actual YouTube revenue, which is directly determined by the Creator's RPM multiplied by their total viewership. A Creator in a high-CPM niche with a predominantly US-based audience will generate more revenue per view — and therefore a larger distribution pool for CRT holders — than a Creator in a lower-CPM niche with a global audience. Seasonal CPM fluctuations also directly affect distributions: Q4 distributions (reflecting October through December revenue) tend to be higher due to elevated holiday advertising spending, while Q1 distributions (reflecting January through March revenue) tend to be lower. Understanding these dynamics helps Investors interpret month-to-month distribution variability without misattributing normal seasonal patterns to Creator underperformance.
This content is for educational purposes only and does not constitute investment advice. CRT investments involve significant risk, including potential total loss of invested capital. Past performance does not predict future results.